
[Man AHL] Campbell Harvey
Very few take a backtested trading strategy’s result at face value. Experienced researchers understand that any historical backtest, no matter how careful the research design, will have some degree of overfitting. As a result, backtested results are overstated. The rule of thumb is to haircut the backtested Sharpe ratio by 50%. The idea of haircutting the Sharpe ratio is a good one – but why 50%?
Statistical tools used to evaluate a trading strategy typically assume no one has examined the data before and only a single strategy has been tried. But where there have been multiple tests, hurdles for establishing statistical significance should be much higher. In fields such as particle physics and biomedical science, they are. In finance, often they are not. Thus many active trading strategies likely are based on findings that overstate Sharpe ratios and other statistical measures.
The usual two-sigma rule only works for a single test. The two-sigma rule is associated with a 5% error rate. However, if a researcher tests 20 factors and uses the same two-sigma rule, the error rate is more like 90%. In order to control the number of false discoveries, it is essential to increase the threshold for declaring a factor "significant". Two-sigma simply means the average return is two standard deviations from zero. The 5% is often associated with the p-value; that is we look for a p-value less than 5%. When many strategies are tested, however, some strategies will have a low p-value purely by chance. As a result adjustments need to be made to ensure only a 5% error rate.
Harvey and Liu provide some easy to implement tools for adjusting evaluation methods to account for multiple tests.
- The Bonferroni method, provides a formula for increasing the standard two-sigma rule for each additional test. Suppose the researcher tries 20 strategies and identifies a strategy three standard deviations from zero with a p-value of 1%. While this is well below the 5% threshold, it is not significant under the Bonferroni adjustment. Bonferroni tells us to multiply the p-value by the number of tests. So the adjusted p-value is not 1% but 20% -- which is much greater than our threshold (and the strategy would be discarded).
- The Holm test takes a similar but slightly less stringent approach.
- The BHY formula, is similar to Holm but allows for an expected proportion of false discoveries. Harvey and Liu judge it the most appropriate for evaluating trading strategies. They also detail a method to gauge the extent of backtest overfitting.
To account for multiple testing, it is common to discount reported Sharpe ratios by 50% when evaluating backtests of trading strategies. There are good economic and statistical reasons for doing so, but this rule of thumb is problematic. The multiple-testing haircut penalizes the highest Sharpe ratios only moderately, but marginal Sharpe ratios heavily.
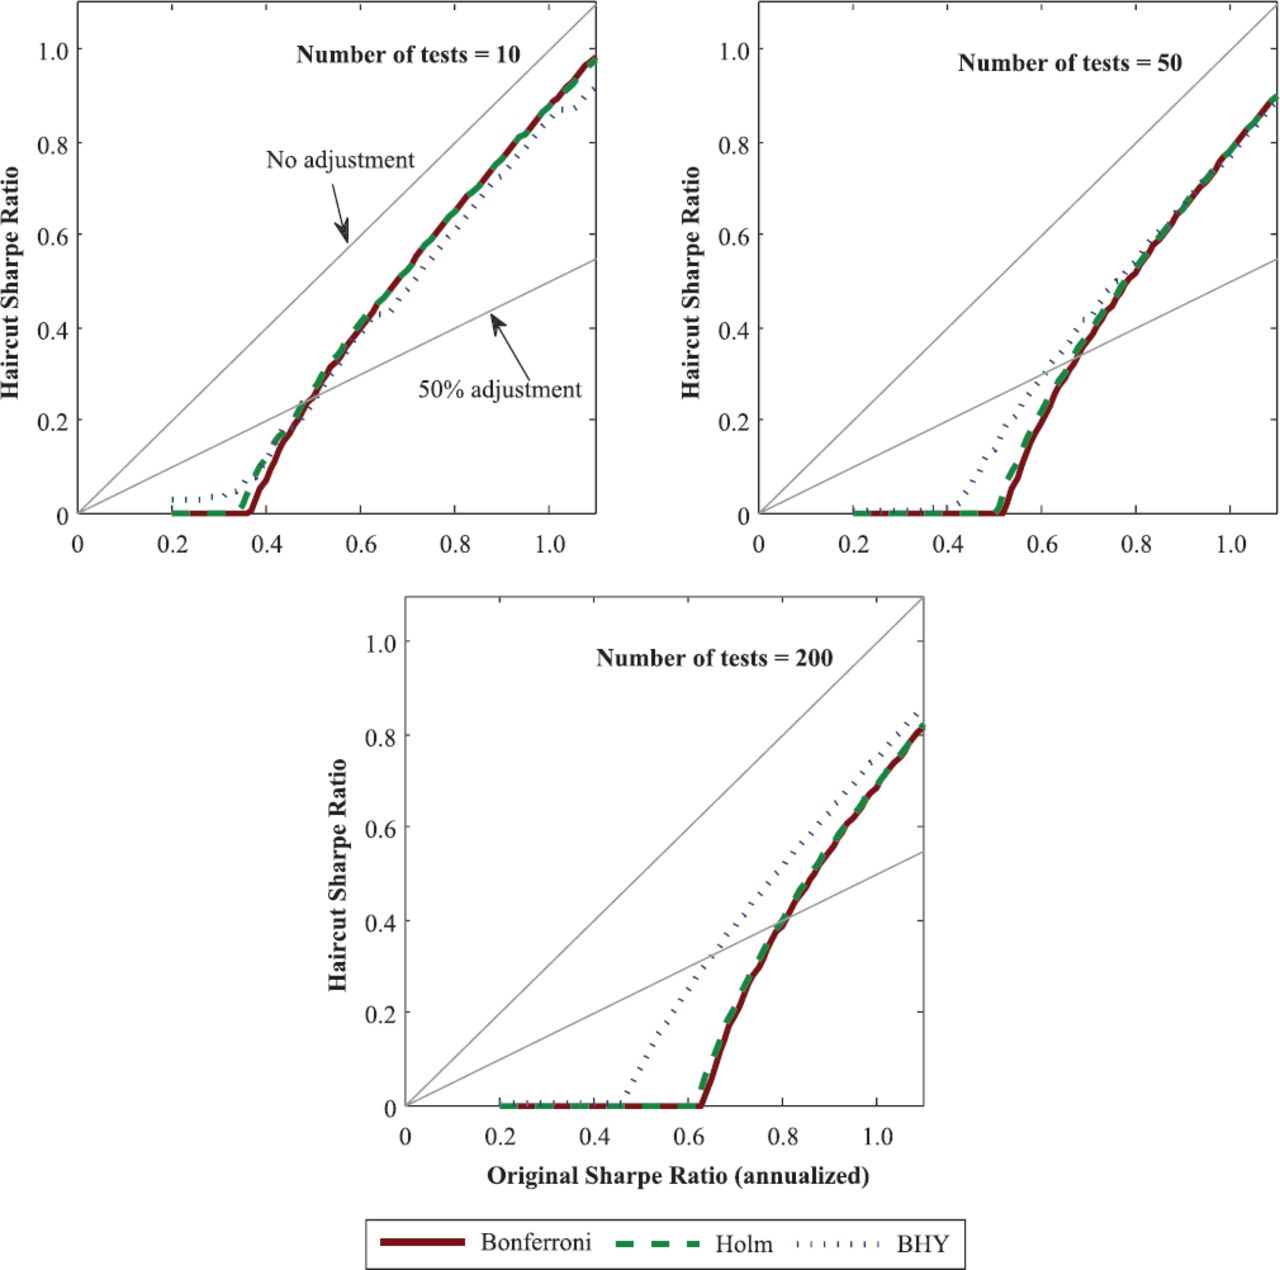 We show that the Sharpe ratio is a simple transformation of the t-statistics. We proceed as follows. The original Sharpe ratio maps to a t-statistic, and we calculate the p-value. We adjust the p-value and then derive the t-statistic associated with that particular adjusted p-value. We transform this into the haircut Sharpe ratio.
Our haircutting of the Sharpe ratio depends on the initial Sharpe ratio as well as on the number of tests. Of course, investors may not know the exact number of tests but it is possible nevertheless to try a range of values. The haircut Sharpe ratio is much different from the simple 50% rule. Strategies with initially large Sharpe ratio are haircut less than 50%. As the initial Sharpe ratio decreases, however, the haircut becomes much more severe, eventually as high as 100%.
Harvey and Liu offer an analytical way to determine the magnitude of the haircut. We propose three multiple-testing procedures that provide adjusted p-values that correspond to t-stats, which are then transformed into new Sharpe Ratios. This method aims to answer the question: if the multiple-testing-adjusted p-value reflects genuine statistical significance, what is the equivalent single-test Sharpe ratio that should be assigned to the strategy as if there were no data mining? True out of sample tests are a cleaner way to evaluate a strategy but they are not available for most trading strategies. Harvey and Liu's method allows investors to make decisions in real time on a proposed strategy's viability.